CYPEX allows users to audit tables and to keep track of login activity. Both live under Monitor & Audit in the admin panel, as two separate entries: Table Audit History and User Audit Trail.
For the enablement path and how row images land in cypex.t_history, start at History Tracking. Permission and organization decisions are a separate stream — see Governance evidence.
Table Audit History
When a table is audited (see Database — Auditing), its change history shows up here. Filter by schema and table using the dropdowns at the top right:
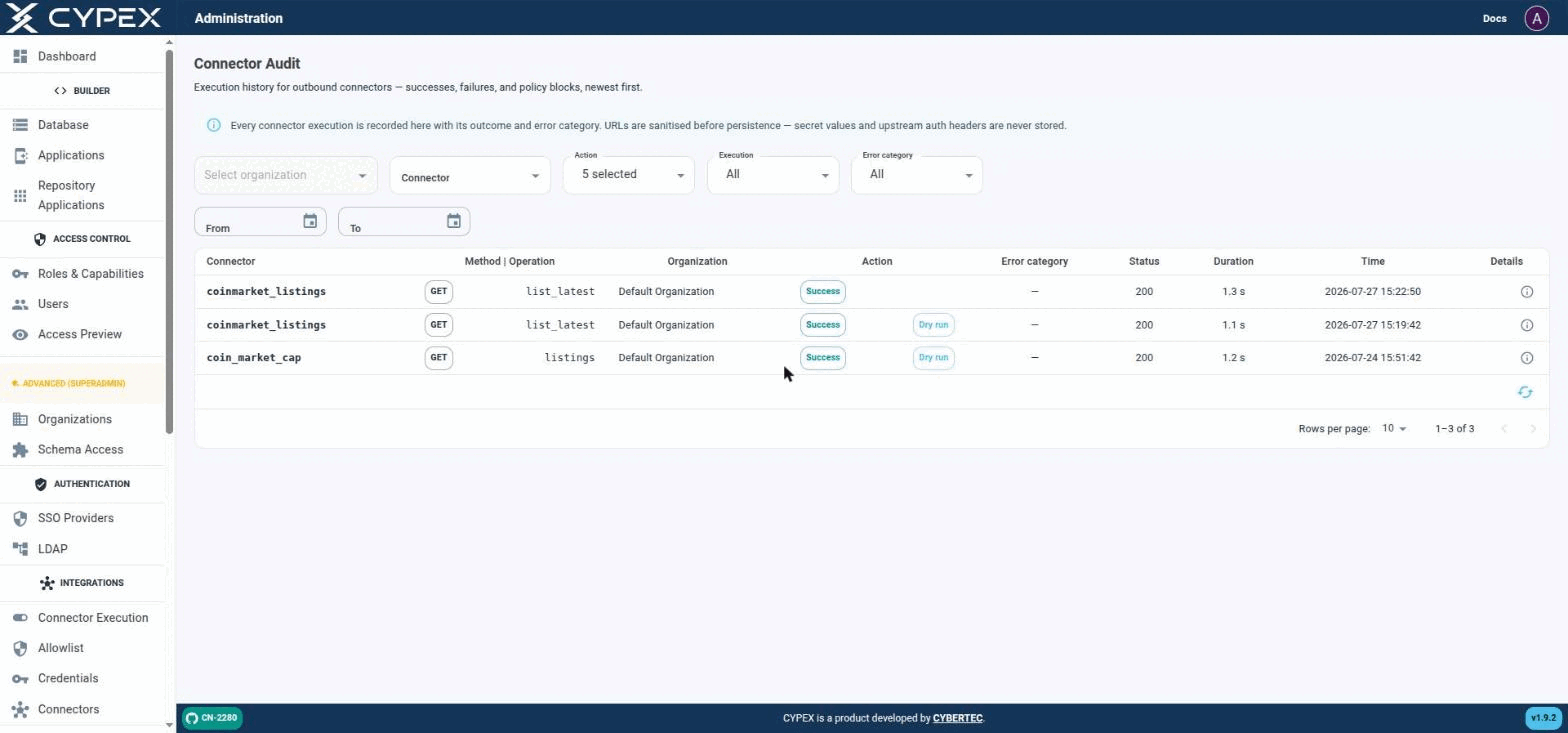
Under Monitor & Audit → Connector Audit, this page is the execution history for outbound connectors — successes, failures, and policy blocks, newest first:
Connector Audit
Live executions (no tag) sit alongside Dry run executions from the builder's Fetch sample / Test response mapping. Both are the same audit trail, distinguished only by the Dry run tag.
Filters
Organization — scope to one tenant.
Connector — scope to one connector definition.
Action — one or more of EXECUTE_STARTED, EXECUTE_SUCCESS, EXECUTE_FAILED, EXECUTE_BLOCKED, EXECUTE_RETRIED, EXECUTE_TIMEOUT.
Execution — All, Live, or Dry run. Dry run covers both the builder’s Fetch sample step and Test response mapping; Live covers real POST /connectors/:id/execute calls.
Error category — filters to one of the categories in Connectors — explicit security boundaries: configuration, schema_validation, policy_block, secret_unavailable, provider_error, timeout, internal.
From / To — date range.
Row details
Each row shows Connector, Method | Operation, Organization, Action (Success/Blocked/etc., plus a Dry run tag when applicable), Error category, Status (HTTP code), Duration, and Time. Click the Details icon for the full record: