This is the hands-on companion to Connectors (the architecture reference) and the individual GUI pages under Administration panel → Integrations. It walks through building one connector end to end, using real screenshots and a real (sanitised) request/response captured while writing this guide.
Before you start
Two things must exist before you can even save a connector — the order below is enforced by the backend, not just a suggested reading order:
Every SSO identity CYPEX has ever seen sits in sso_gateway.t_sso_user_map in exactly one of three states (sso_gateway.user_map_status): pending, active, or rejected. This page documents the full lifecycle — what moves a row between states, what each transition writes to the audit trail, and where to find evidence of a governance decision. For adding a provider and the first successful sign-in, see the OIDC setup guide.
States
State
Meaning
What a repeat login does
Pending
IdP authentication succeeded, but no t_sso_role_mapping rule matched and (if Auto-link by email is off, the default) no admin has reviewed it yet. cypex_user_id and cypex_role are both NULL.
Refreshes the captured profile in place, stays pending. The exchange returns 403 pending_approval — “Your account is pending administrator approval.”
Active
An admin approved or linked the identity, or a role mapping matched automatically. cypex_user_id and cypex_role are set.
Signs in normally; mints an access/refresh token pair like any other login.
Rejected
An admin explicitly rejected the identity. The row is kept (not deleted) — rejected_at, rejected_by, and an optional rejection_reason (≤200 characters) are recorded.
Blocked. The exchange returns 403 user_rejected — a deliberately generic “This SSO identity has been blocked. Contact your administrator.” The real reason and who rejected it never reach the browser; they’re in the audit trail only.
Users → Pending SSO and Users → Rejected SSO are the two admin-facing queues for the states above:
A change that affects a tenant boundary should be reconstructable afterwards.
CYPEX records part of that automatically and leaves the rest to you. This page
documents the three layers where evidence lives, in order of increasing
persistence:
The permission audit log — queryable in PostgreSQL.
The write path — what CYPEX captures automatically, and what it does not.
Documentation approvals — recorded in product docs and release notes.
If you make a non-trivial decision about an Organization (split, merge, role
remap, schema revoke), keep the audit query and its output with the change
record, and add an ADR-style note under
CYPEX internals.
CYPEX may store data that requires a durable change trail. History
tracking (table auditing) records every INSERT, UPDATE, DELETE, and
TRUNCATE on a selected entity in cypex.t_history. Each entry holds before
and after JSON images, a timestamp, the PostgreSQL role that made the
change, and — when the change came through CYPEX — the CYPEX user id.
Changes made directly against the table are captured too, so no separate
application-level logging layer is required for those row events.
CYPEX allows users to audit tables and to keep track of login activity. Both live under Monitor & Audit in the admin panel, as two separate entries: Table Audit History and User Audit Trail.
For the enablement path and how row images land in cypex.t_history, start at History Tracking. Permission and organization decisions are a separate stream — see Governance evidence.
Table Audit History
When a table is audited (see Database — Auditing), its change history shows up here. Filter by schema and table using the dropdowns at the top right:
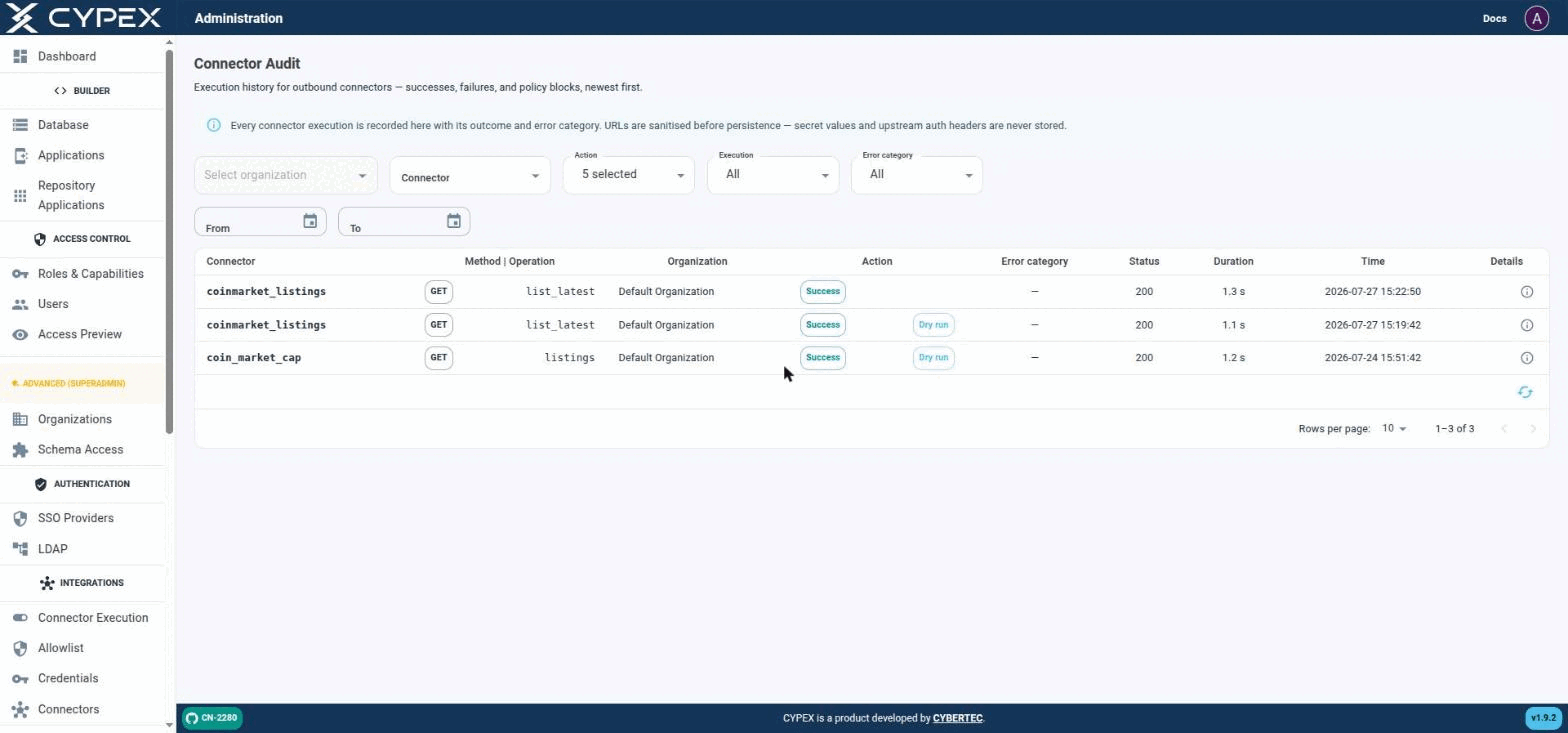
Under Monitor & Audit → Connector Audit, this page is the execution history for outbound connectors — successes, failures, and policy blocks, newest first:
Connector Audit
Live executions (no tag) sit alongside Dry run executions from the builder's Fetch sample / Test response mapping. Both are the same audit trail, distinguished only by the Dry run tag.
Filters
Organization — scope to one tenant.
Connector — scope to one connector definition.
Action — one or more of EXECUTE_STARTED, EXECUTE_SUCCESS, EXECUTE_FAILED, EXECUTE_BLOCKED, EXECUTE_RETRIED, EXECUTE_TIMEOUT.
Execution — All, Live, or Dry run. Dry run covers both the builder’s Fetch sample step and Test response mapping; Live covers real POST /connectors/:id/execute calls.
Error category — filters to one of the categories in Connectors — explicit security boundaries: configuration, schema_validation, policy_block, secret_unavailable, provider_error, timeout, internal.
From / To — date range.
Row details
Each row shows Connector, Method | Operation, Organization, Action (Success/Blocked/etc., plus a Dry run tag when applicable), Error category, Status (HTTP code), Duration, and Time. Click the Details icon for the full record: