
Custom Chart
A flexible, fully customizable dynamic chart viewport driven by a source query and custom option expressions, featuring custom color theme pickers, sorting controls, and interactive toolbox utilities (save as image, clear selection, data view table, area zoom, magic type switch).
- Visualizing complex, non-standard, or highly customized multi-coordinate charts where standard chart types (bar, line, pie, scatter) do not offer sufficient option flexibility.
- Configuring fully dynamic charts backed by a source query with bespoke chart option expressions, theme palettes, and interactive toolbox features.
Requires selecting a backing database query from the Source View dropdown and providing a valid chart Option expression to dictate how coordinates and series render.
Line Chart
A dynamic 2D line chart visualizing trend lines along X and Y coordinates, supporting multiple Y-value line series, filled area options, custom legend aliases, theme presets, and interactive toolbox tools (area zoom, image export, data view, magic type switch to bar chart).
- Visualizing continuous data trends, time-series metrics, or multi-series numerical comparisons over sequential intervals.
- Plotting dynamic query data along X and Y axes using lines, with support for filled area line fills, stacked lines, and value data point labels.
Requires an active Source Query. Select an ordered property for Label (X coordinate) and one or more numerical columns for Value (Y coordinate). Multiple value mappings generate multi-line trend comparisons.
Scatter Plot (Chart)
A dynamic 2D scatter plot rendering unconstrained point clouds along X and Y axes, complete with symbol sizing, polar coordinate modes, point clustering, regression trend lines, legend aliases, and interactive toolbox utilities.
- Plotting non-sequential numerical point clouds to observe correlations, clusters, distributions, or outliers across two independent coordinates.
- Visualizing statistical relationships with advanced scatter options such as regression analysis trendlines, point clustering, or polar coordinate representations.
Requires an active Source Query. Select a numerical column property for Label (X coordinate) and one or more numerical columns for Value (Y coordinate). Multiple value mappings generate distinct multi-colored point series.
Built-in expressions
Let’s come to a core concept of CYPEX: expressions. What you actually see in the GUI isn’t just some static field, but in fact, a JavaScript expression which can be modified. This gives you a great deal of flexibility and allows you to tailor the GUI to your needs. Using JavaScript expressions, you have great power at your fingertips.
However, most people aren’t heavy JavaScript users and therefore a lot of the more common tasks have been simplified by adding graphical shortcuts. One of these shortcuts was shown before: ID resolution. What the GUI element actually does is to modify the underlying JavaScript relation in the desired way.
Calling server side code
A workflow is a good start if you want to build an application. However, sometimes it’s still necessary to add control elements. In this section, you’ll learn to add buttons and to write server side code to make your application even more powerful.
CYPEX lets you write PostgreSQL functions directly in the admin panel. Those functions are served by PostgREST, the same component that serves your queries: a function in the exposed schema becomes an RPC endpoint at /rpc/<function_name>, called with POST and executed as the role in the caller’s JWT. Data and logic therefore travel the same path and obey the same PostgreSQL permissions.
CYPEX internals
In this section, you’ll be guided through the internals of CYPEX. You’ll get to know the basic architecture of the solution and gain some insights into how things work. It helps to understand some basic concepts, in order to use CYPEX even more efficiently.
Before you look at the architecture of a CYPEX app from an end user perspective, you’ll first want to understand the overall software layout:
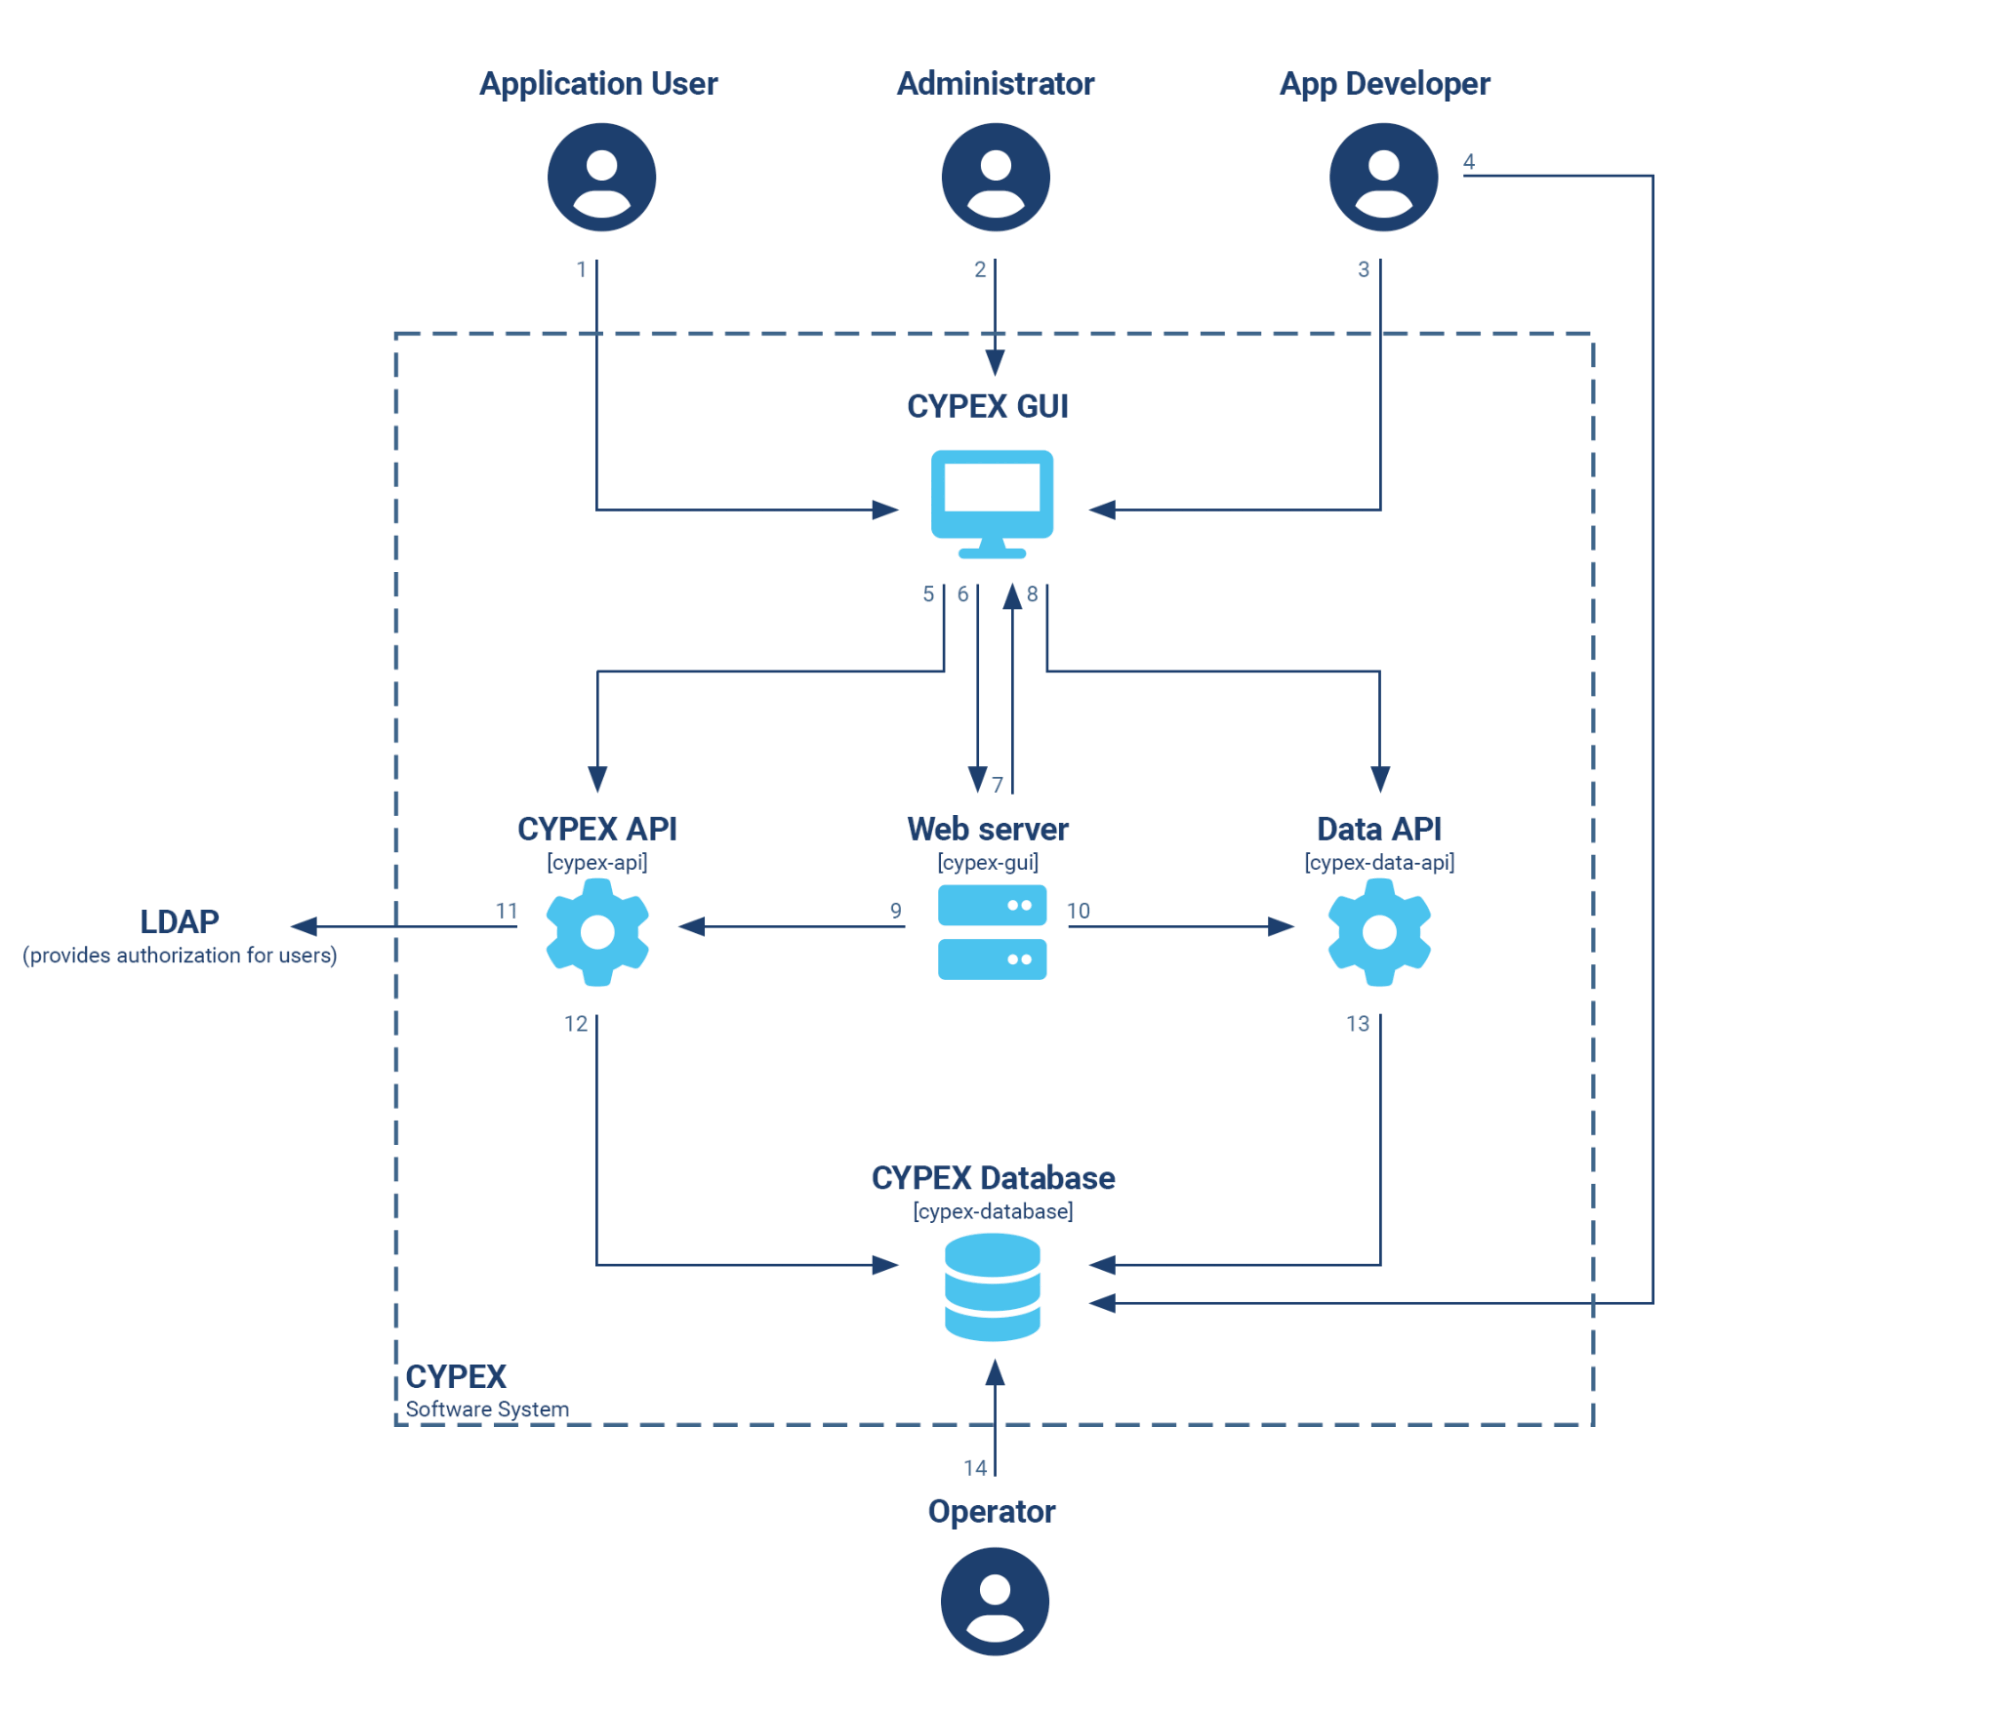
CYPEX is delivered as a set of Docker containers, which makes deployment easy and efficient. In general, CYPEX can run on top of an existing, standard PostgreSQL database. There are no dependencies on external extensions.
CYPEX Online Academy
CYPEX Online Academy is Cybertec’s video curriculum for CYPEX. The current catalog and publish status live on the CYPEX Online Academy landing page.
The topics the curriculum covers are documented in written form here:
| Topic | Documentation |
|---|---|
| Admin panel overview | Administration Panel |
| Organizations and data scope | Organizations |
| Capabilities vs Data Scope | Capabilities vs Data Scope |
| SSO / OIDC setup | OIDC setup guide |
| Connector setup | Connectors setup guide |
| Building apps across organizations | Building apps across organizations |